PPO Liabilities: modelling mortality risks
There are a lot of uncertainties inherent in the valuation and capital modelling of Periodical Payment Order (“PPO”) liabilities. Not only is there no perfect hedge for the inflation indices applied to them, there is also very limited data upon which to base mortality models.
While much has been written on the challenges presented by liabilities indexed to care-worker salaries, less analysis has been performed on the way in which these are confounded with the various mortality risks in PPO claims, and how their importance varies according to portfolio size.
We illustrate below how portfolio size impacts the variability of outcomes, how varying the net discount rate (ie discount rate in excess of inflation) has a compounding effect on some of these mortality risks, and how other undesirable effects arising from mortality risk appear to persist regardless of portfolio size.
Different types of mortality risks in PPOs
The mortality risks arising from a PPO claim can be divided into 3 categories, namely:
- Idiosyncratic risk – this is the risk that, even when the base mortality rates and mortality trend have been estimated correctly, individuals almost never die when expected(!)
- Base table risk – this is the risk that the base mortality rates have been mis-estimated at the outset. For a PPO claim, the main source of base table risks comes from the estimation error of the claimant’s life expectancy. A secondary source of base table risks comes from mis-fitting the shape of the mortality curve for a given life expectancy.
- Trend risk – this is the risk that the expected future mortality improvements have been mis-estimated. In our view this provides the greatest source of mortality uncertainty to large risk carriers and across the marketplace as a whole.
As might be expected, the following illustrations predict that for a small claim portfolio, mortality risks are dominated by idiosyncratic risks. As the claimant portfolio size increases, base table and then trend risks start to dominate the residual variability.
An illustrative model for PPOs
To illustrate the importance of the different mortality risks, we have built a Monte Carlo simulation model in R applied to a portfolio of 1, 10, 50 and 100 identical PPOs in payment. In this application of the model we have allowed for idiosyncratic, base table and trend risk applied to the ONS 2012 mortality projections, a symmetric random error in mortality trend and a constant 5% pa inflation rate. 100,000 simulations were run.
Note that the results here represent just one of many models. While they inform discussions on the key principles they should not be used without careful customisation to the particular portfolio.
Results – PPO Cashflow analysis
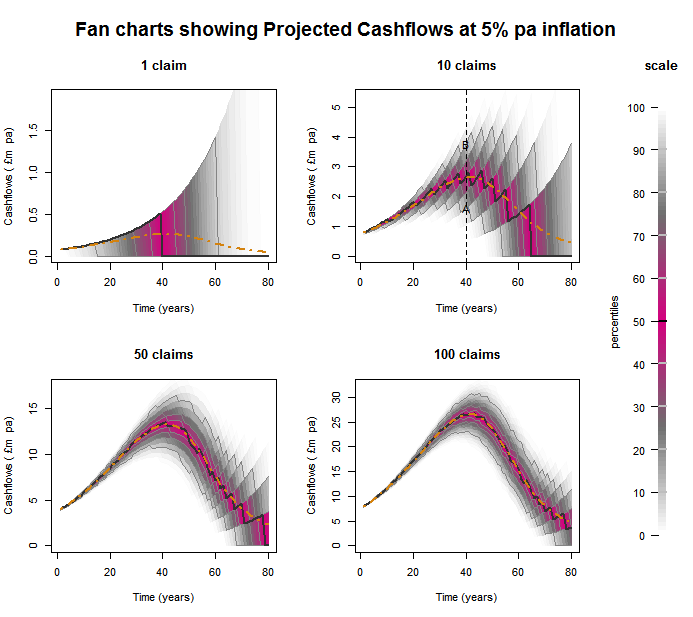
The four charts below show the cashflow projections for each claim portfolio. The orange dashed line shows the mean cashflows, with the pink ranges indicating central percentiles and grey ranges indicating tail results in each year. For instance take the top right chart for a portfolio with 10 claims, points A and B are the 10th and 90th percentiles respectively of the projected cashflows in 40 years’ time.
The following can be seen:
- With one claim, the uncertainty is dominated by the unknown date of death of the annuitant.
- As the number of PPOs increases, the shape of the cashflow distribution converges to the mean cashflows.
- The stepped shape of the curves arises when there are small numbers of remaining annuitants. This results in increasing discontinuities as the number of remaining lives passes each plotted percentile.
- Even as the number of annuitants increases, the residual variability arising from base table and trend risk does not diminish. These systemic components gear up with the uncertainty arising from inflation risk, resulting in a wider range for later cashflows.
Results – PPO valuation
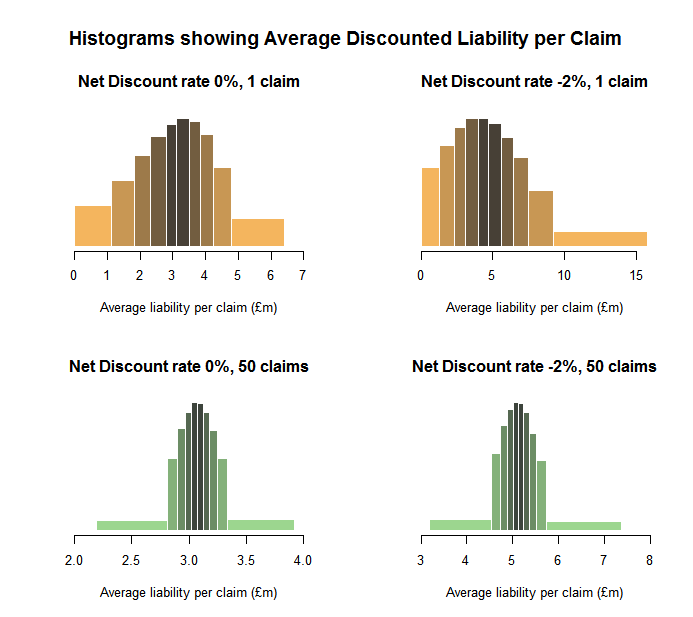
The two sets of histograms below show the effect of varying the portfolio size and the net discount rate (ie discount rate in excess of inflation) on the distribution of discounted liabilities. Each bar in the plots has the same area and comprises a 10-percentile band of simulation results. For example, in the top right chart, the top 10% of simulations have an average discounted liability per claim in the £9 million to £16 million range.
From the charts below, we can see three important themes emerging:
- Average per claim variability diminishes with increasing portfolio size (although clearly the aggregate variability increases).
- Changing the discount rate has an impact on the skewness of the distribution of outcomes, with decreases in the assumed net discount rate making the result more positively skew. This skewing effect reduces as the portfolio size increases.
- Most striking is how variability changes as the portfolio size increases. While the overall variability appears to have reduced, the shape of the distribution has also changed. There are now higher peaks surrounding the median average claim size accompanied by heavier tails. This effect emerges regardless of the discount rate used and is caused by the trend risk.
Conclusion
It is clear that modelling PPO liabilities presents some new challenges for general insurers. In particular:
- The nature and timescale over which PPOs operate is not consistent with standard general insurance capital models.
- Mortality and inflation/ discounting risks combine to result in adverse scenarios considerably worse than potential upside outcomes.
- For both reinsurers and insurers considering pooling/ reinsurance options, certain systemic features of mortality risk need careful attention. When looking at outcomes over a time horizon longer than one year (eg in an ORSA), larger portfolios need to understand the heavier-tailed distributions that apply.